Back
7 Feb 2020
Gold Price Analysis: XAU/USD pressuring 1570 resistance post-NFP
- The market is forming a base above $1550/oz level.
- The 1570/75 area is an important resistance zone.
- The US economy has gained 225,000 jobs in January.
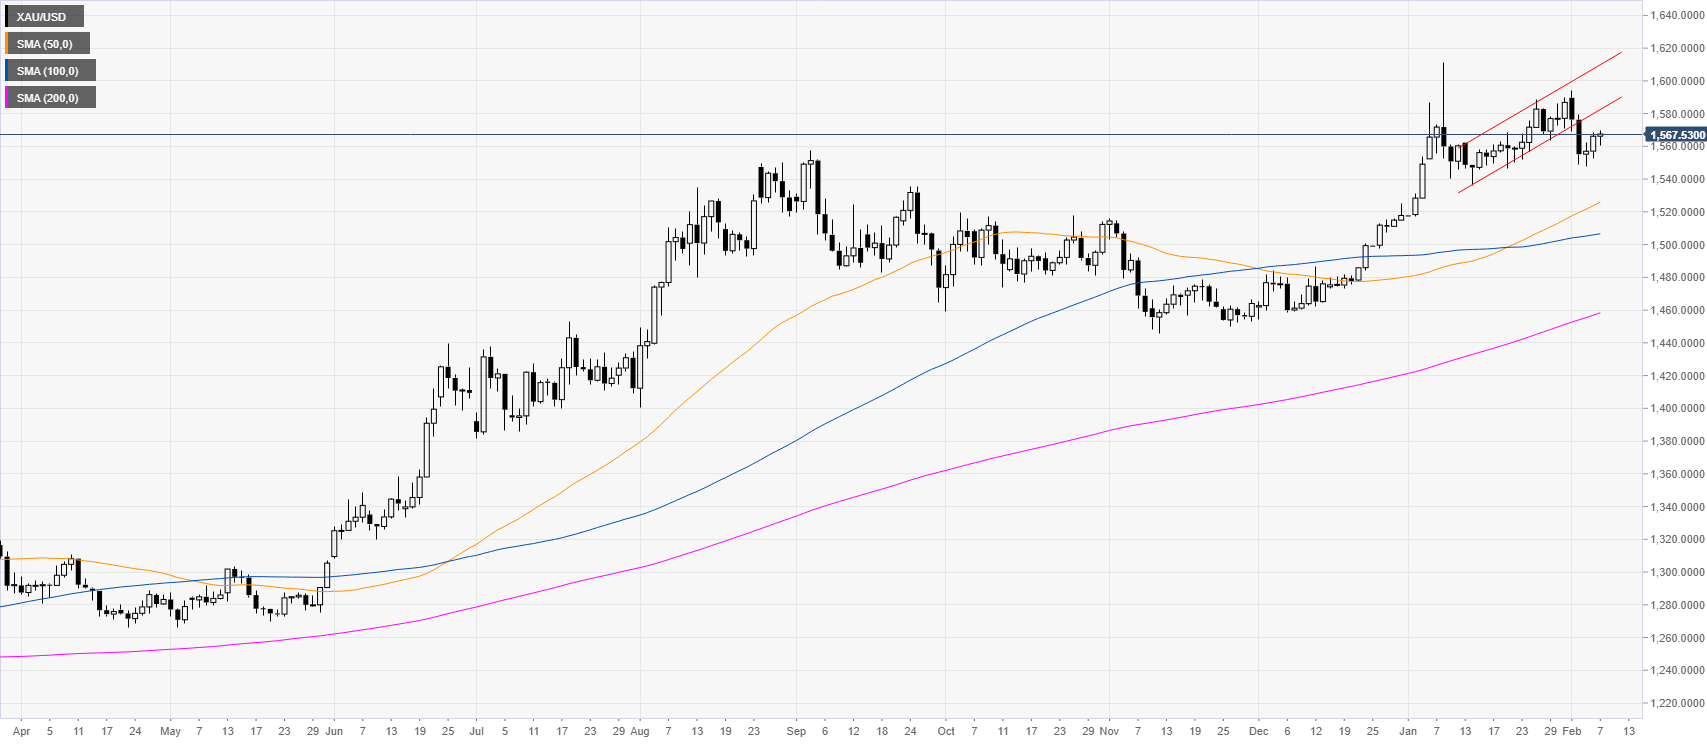
Gold daily chart
XAU/USD is trading in a bull trend above the main daily simple moving averages (SMAs). However, the metal broke below a bear flag and gold is recovering slightly in the last two days. The US Non-farm payrolls came in above expectations at 225K vs. 160K forecast. However, gold remains supported.
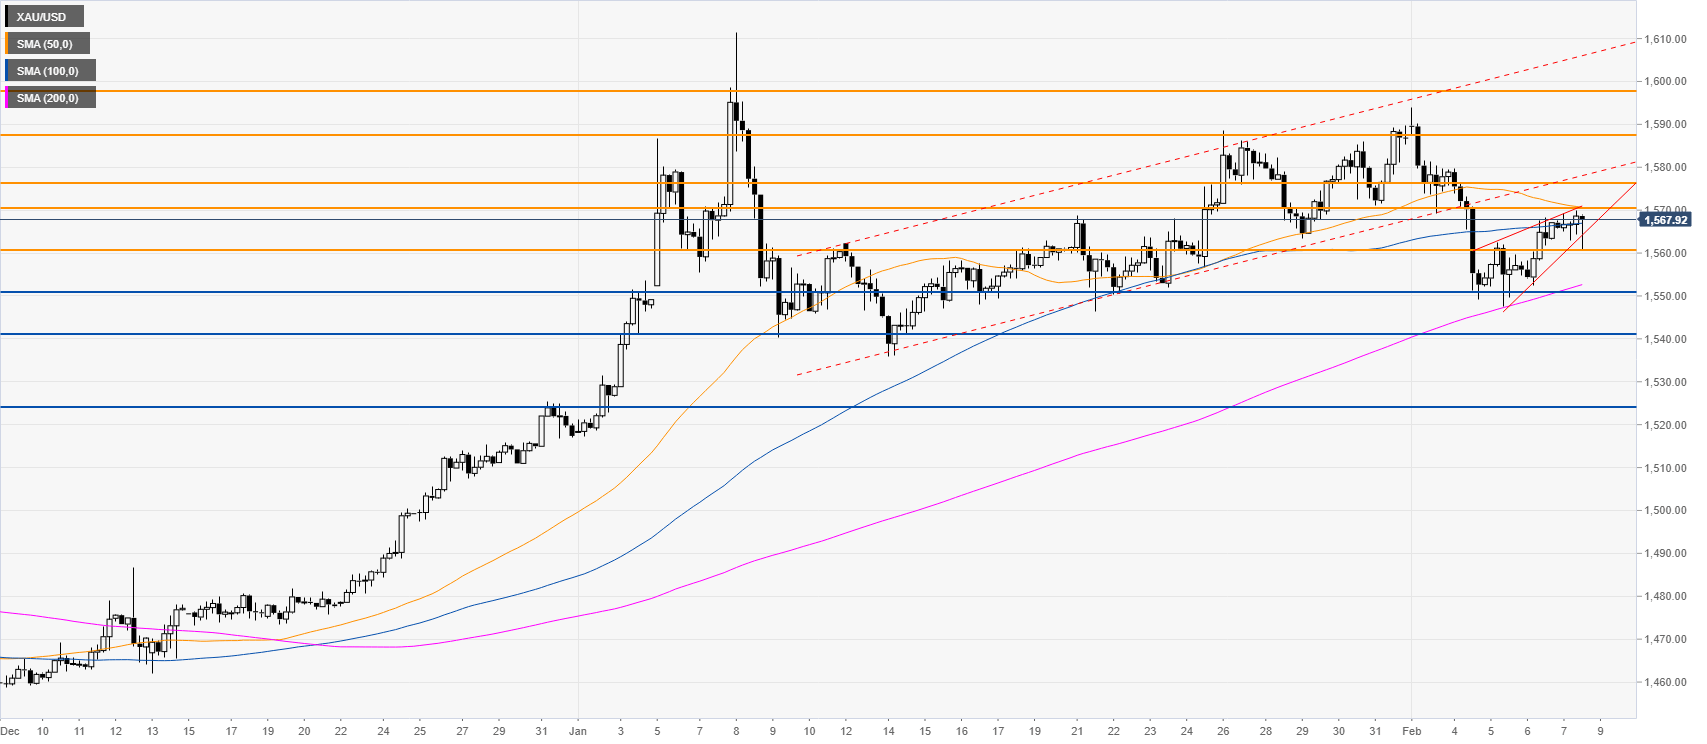
Gold four-hour chart
The market is forming a base near the 1550 level and the 200 SMA on the four-hour chart. The bulls would need a clear break above the 1570/75 resistance zone to re-establish the bullish bias. On the flip side, if gold fails to make any progress above the above-mentioned price zone, XAU/USD might become vulnerable to bearish incursions. If sellers break below the 1550 support, it can expose the 1540 level and possibly 1525 to the downside.
Additional key levels